

May 9, 2024
At 50.3, the Global Manufacturing PMI, sponsored by JPMorgan and compiled by S&P Global Market Intelligence, remained above 50.0 neutral mark (and therefore marginally in expansion territory) for a third successive month in April, albeit the rate of improvement moderating fractionally from March’s 20-month high of 50.6. Despite the cooling in the rate of improvement, the latest data signal an ongoing steadying of the global manufacturing economy so far in 2024 after almost one and a half years of decline.
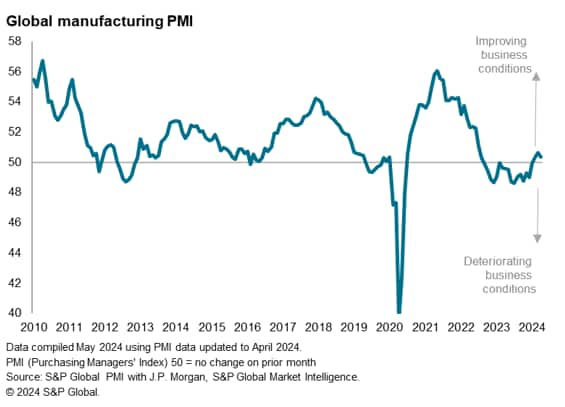
Here are our top five takeaways from the survey and its various sub-indices, which show output staging a modest recovery on the back of a return to growth for global trade. Supply chains have meanwhile improved further after initial Red Sea related disruptions at the start of the year. But while supply constraints do not currently pose a threat to inflation, tight labour markets continue to exert upward pressure on prices via wage costs. The overall rate of selling price increase nevertheless remained broadly in line with the pre-COVID historical average in April.
1: Resurgent output in 2024
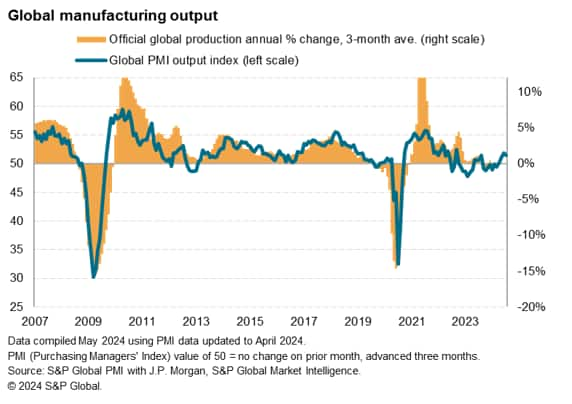
The survey’s sub-index of production, which tracks actual factory output changes, signaled a fourth successive monthly expansion of production in April. Although the rate of increase moderated slightly in April, the last three months have seen the strongest output gain in nearly two years to suggest the official industrial production data for manufacturing will likely follow the PMI trend higher in the coming months.
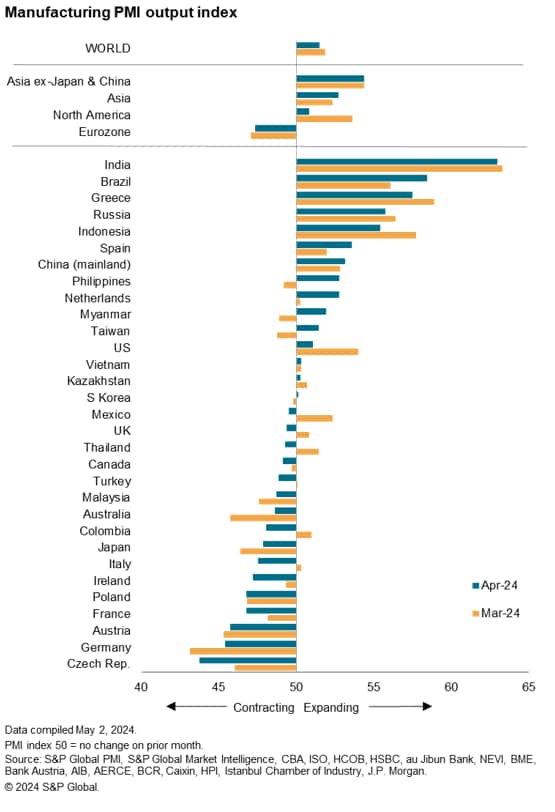
The improvement was again led by Asia, and India in particular, while Europe remained a drag on the global upturn. Output continued to fall in the eurozone, albeit at a reduced rate, and a renewed decline was seen in the UK. However, the steepest decline of all countries covered by the global PMI was seen in Czechia.
Growth meanwhile slowed in the US but accelerated in mainland China, and a notable acceleration helped lift Brazil into second place in the global rankings, followed by Greece, Russia and Indonesia.
2: Merchandise exports return to growth
New orders rose marginally globally for a third straight month, indicating a stabilization of demand after one and a half years of continual decline. Particularly encouraging was a return to growth of new export orders for goods, which represented the first upturn in global merchandise trade after more than two years of deterioration.
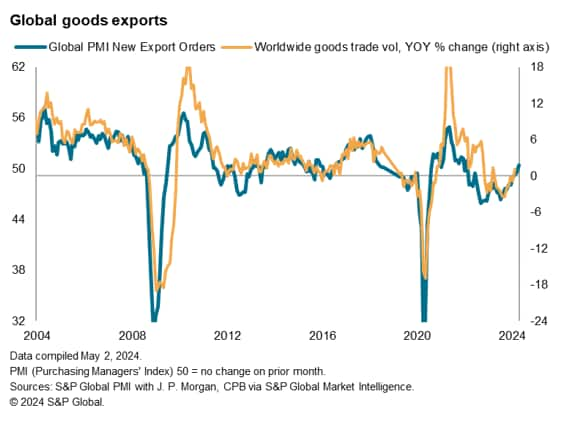
The strongest export gains were seen in India, Greece and mainland China. Declines were generally concentrated in Europe and only a modest increase was reported in the US.
3: Improving supply chains
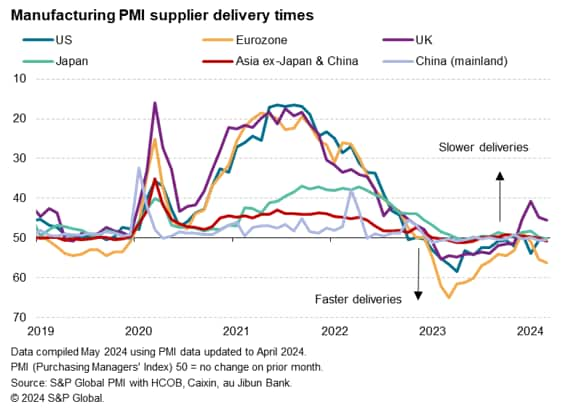
Global supply chain performance meanwhile improved in April to the greatest extent since last September, as indicated by a quickening of supplier delivery times. The improvement marks a further turnaround from the delays seen in January in response to the initial impact of the Red Sea shipping disruptions. As such, the PMI data point to both a limited and modest supply chain impact globally so far from the Red Sea issues.
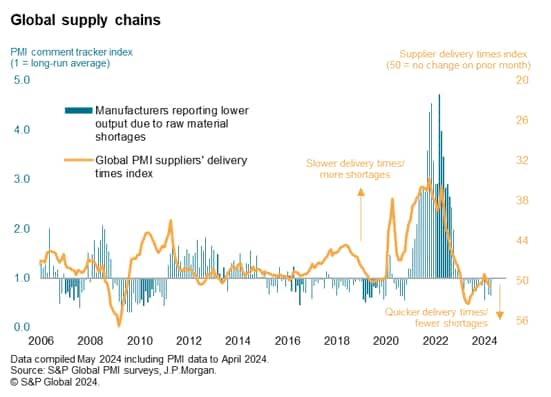
It was also encouraging to see the PMI Comment Tracker data reveal that the number of manufacturers reporting that output had fallen in April due to input shortages is running below the pre-pandemic ten-year average, suggesting that there are relatively few supply-related capacity constraints in the global factory system.
The UK was a notable outlier among the major economies in seeing longer delivery times in April, however, as ongoing Red Sea impacts were reported alongside Brexit-related import issues. Only Myanmar, Australia and Greece reported longer delivery delays than the UK.
4. Pay pressures persist as labour markets remain tight
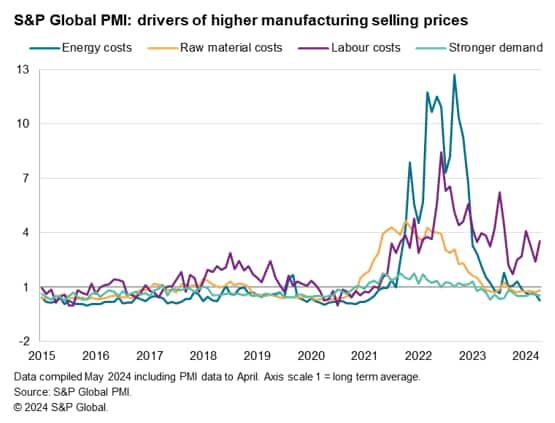
While the improved supply situation points to few supply-chain related price pressures, a principal driver of higher selling prices in April was staff costs, according to the global PMI Comment Trackers. While upward prices pressure from energy, raw materials and demand remained muted by historical standards, upward pressure from wages and salaries was reported to have been running at three and a half times the long run average in April.
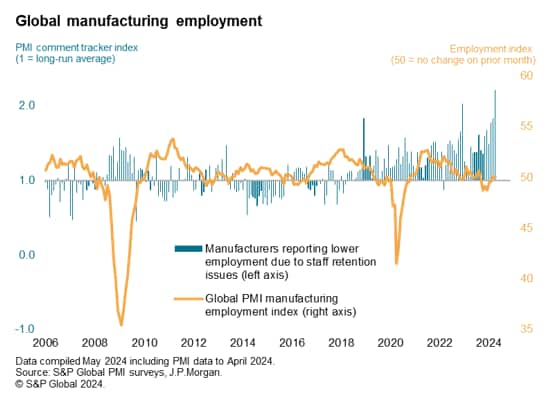
Some of this wage pressure emanates from the tightness of the labour market. Manufacturing employment was broadly stable worldwide in April, as additional hiring in some firms offset reduced headcount in others. Of concern, those firms reporting lower employment noted that problems in retaining staff had risen to levels exceeding anything previously recorded by the survey, according to the global PMI Comment Tracker database, which commenced in 2005. There is therefore a suggestion that hiring is being constrained by the tightness of the labour markets around the world, which seems likely to drive wages further higher in the near-term.
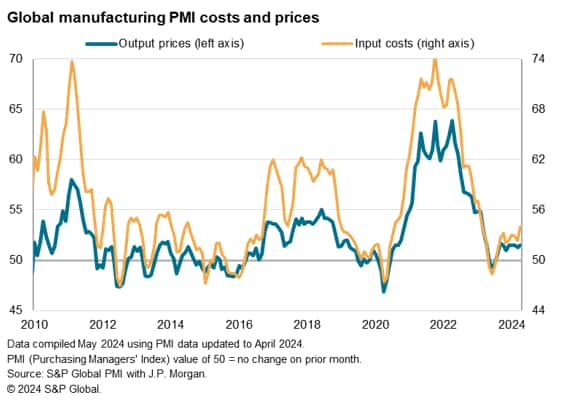
5: Higher costs point to upside price risks
There was encouraging news on prices charged for goods, however, which rose in April at a rate that has now been largely unchanged for eight months. The current rate of increase is also only very marginally above the pre-pandemic ten-year average. However, input costs rose at the sharpest rate for 14 months, breaking out of the more modest inflation range seen in recent months. While, at 54.0, the global input cost index still continues to run well below the pre-pandemic decade average of 55.6. Rising costs look likely to exert some upward pressure on selling prices in May.
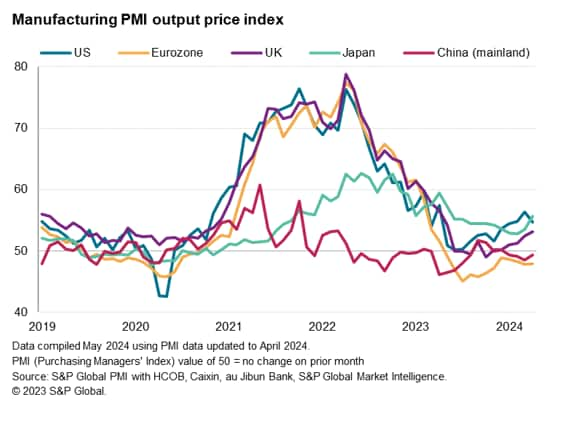
Rates of selling price inflation varied markedly around the world. The rate of increase accelerated in Japan to run ahead of the slowing (but still solid) pace seen in the US. Only Myanmar and Turkey reported higher rates of inflation than seen in Japan. The rate of inflation also accelerated in the UK, climbing to an 11-month high. In contrast, prices continued to fall in both the eurozone and in mainland China, with noteworthy declines also seen in Vietnam and Taiwan.
Source: S&P – by Chris Williamson
Legal Notice: The information in this article is intended for information purposes only. It is not intended for professional information purposes specific to a person or an institution. Every institution has different requirements because of its own circumstances even though they bear a resemblance to each other. Consequently, it is your interest to consult on an expert before taking a decision based on information stated in this article and putting into practice. Neither Karen Audit nor related person or institutions are not responsible for any damages or losses that might occur in consequence of the use of the information in this article by private or formal, real or legal person and institutions.


