November 2, 2023
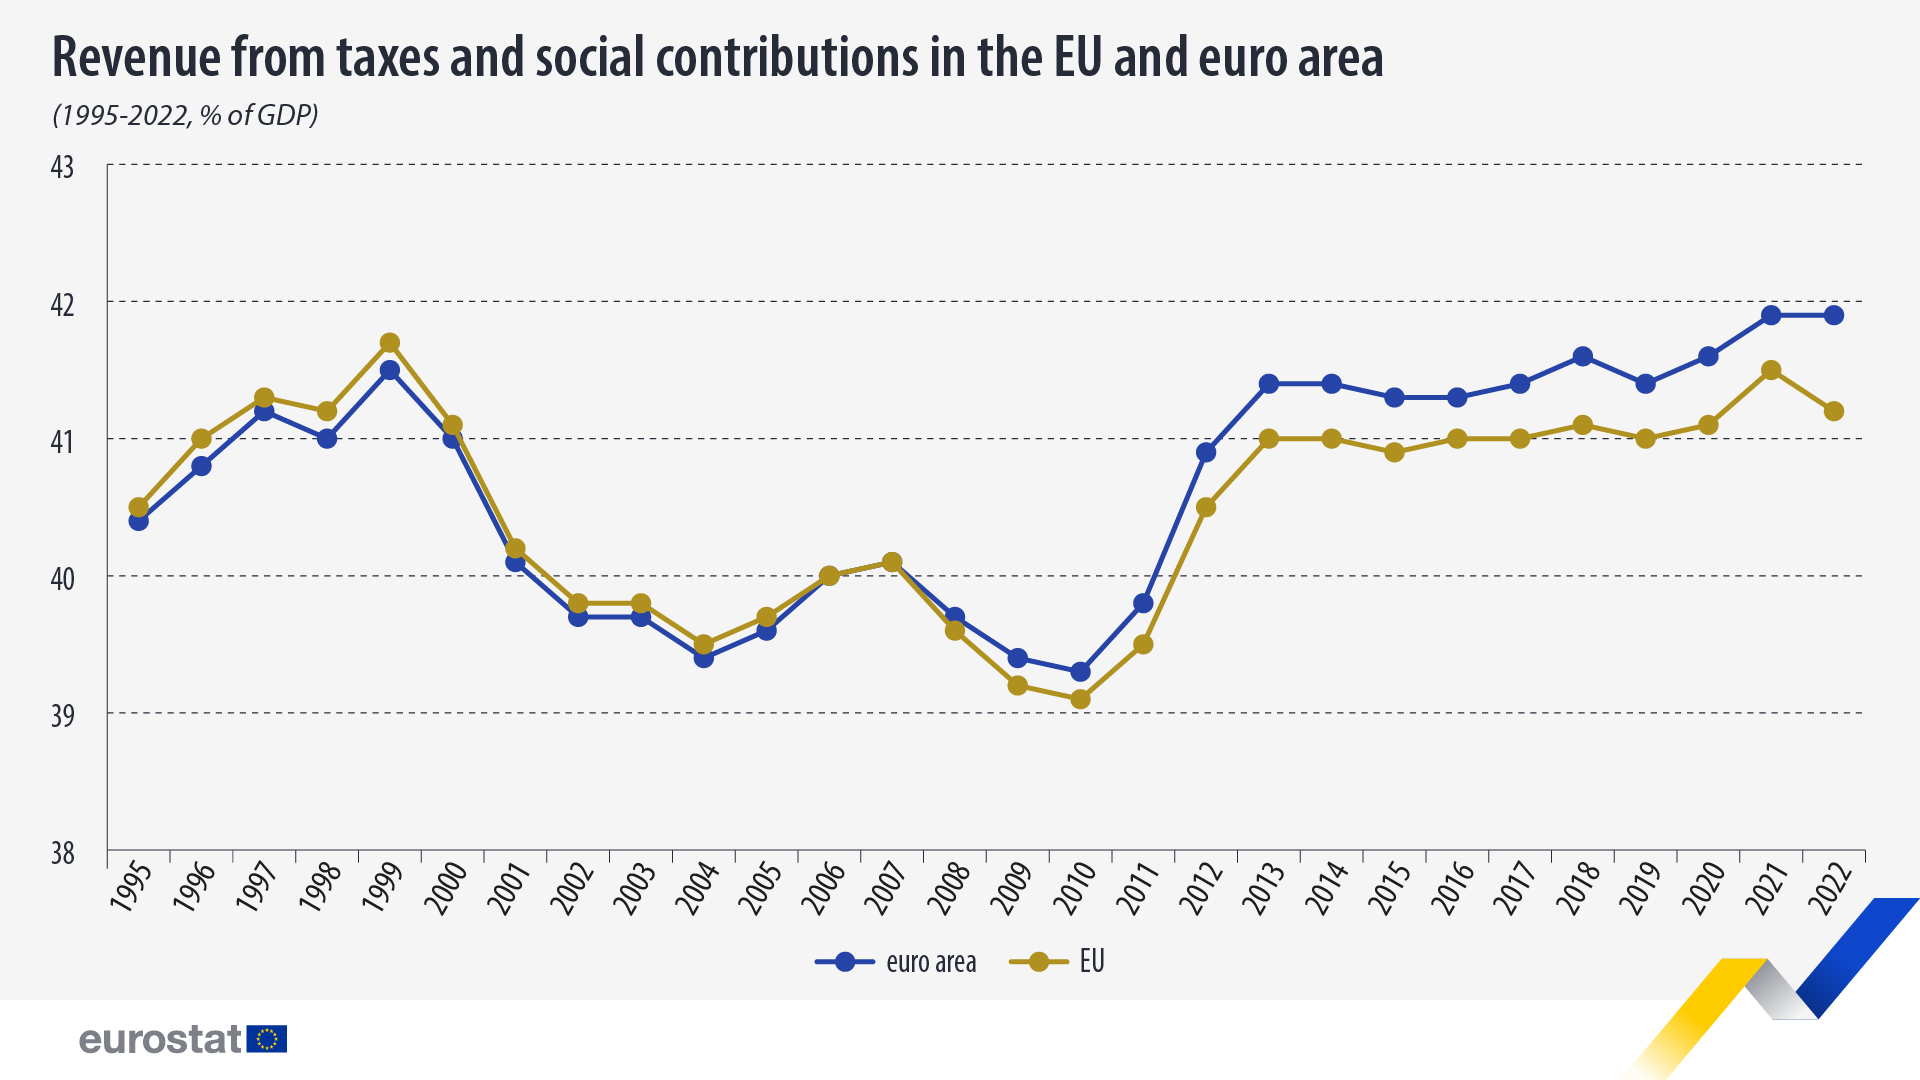
The overall tax-to-GDP ratio, meaning the sum of taxes and net social contributions as a percentage of gross domestic product (GDP), stood at 41.2% in the EU in 2022, a decrease compared with 2021 (41.5%). In the euro area, tax revenue increased in line with nominal GDP, meaning that the tax-to-GDP ratio in 2022 remained stable at 41.9%.
In absolute terms, in 2022, revenue from taxes and social contributions increased by €480 billion in the EU compared with 2021, to stand at €6 549 billion.
Highest tax-to-GDP ratio in France, Belgium and Austria
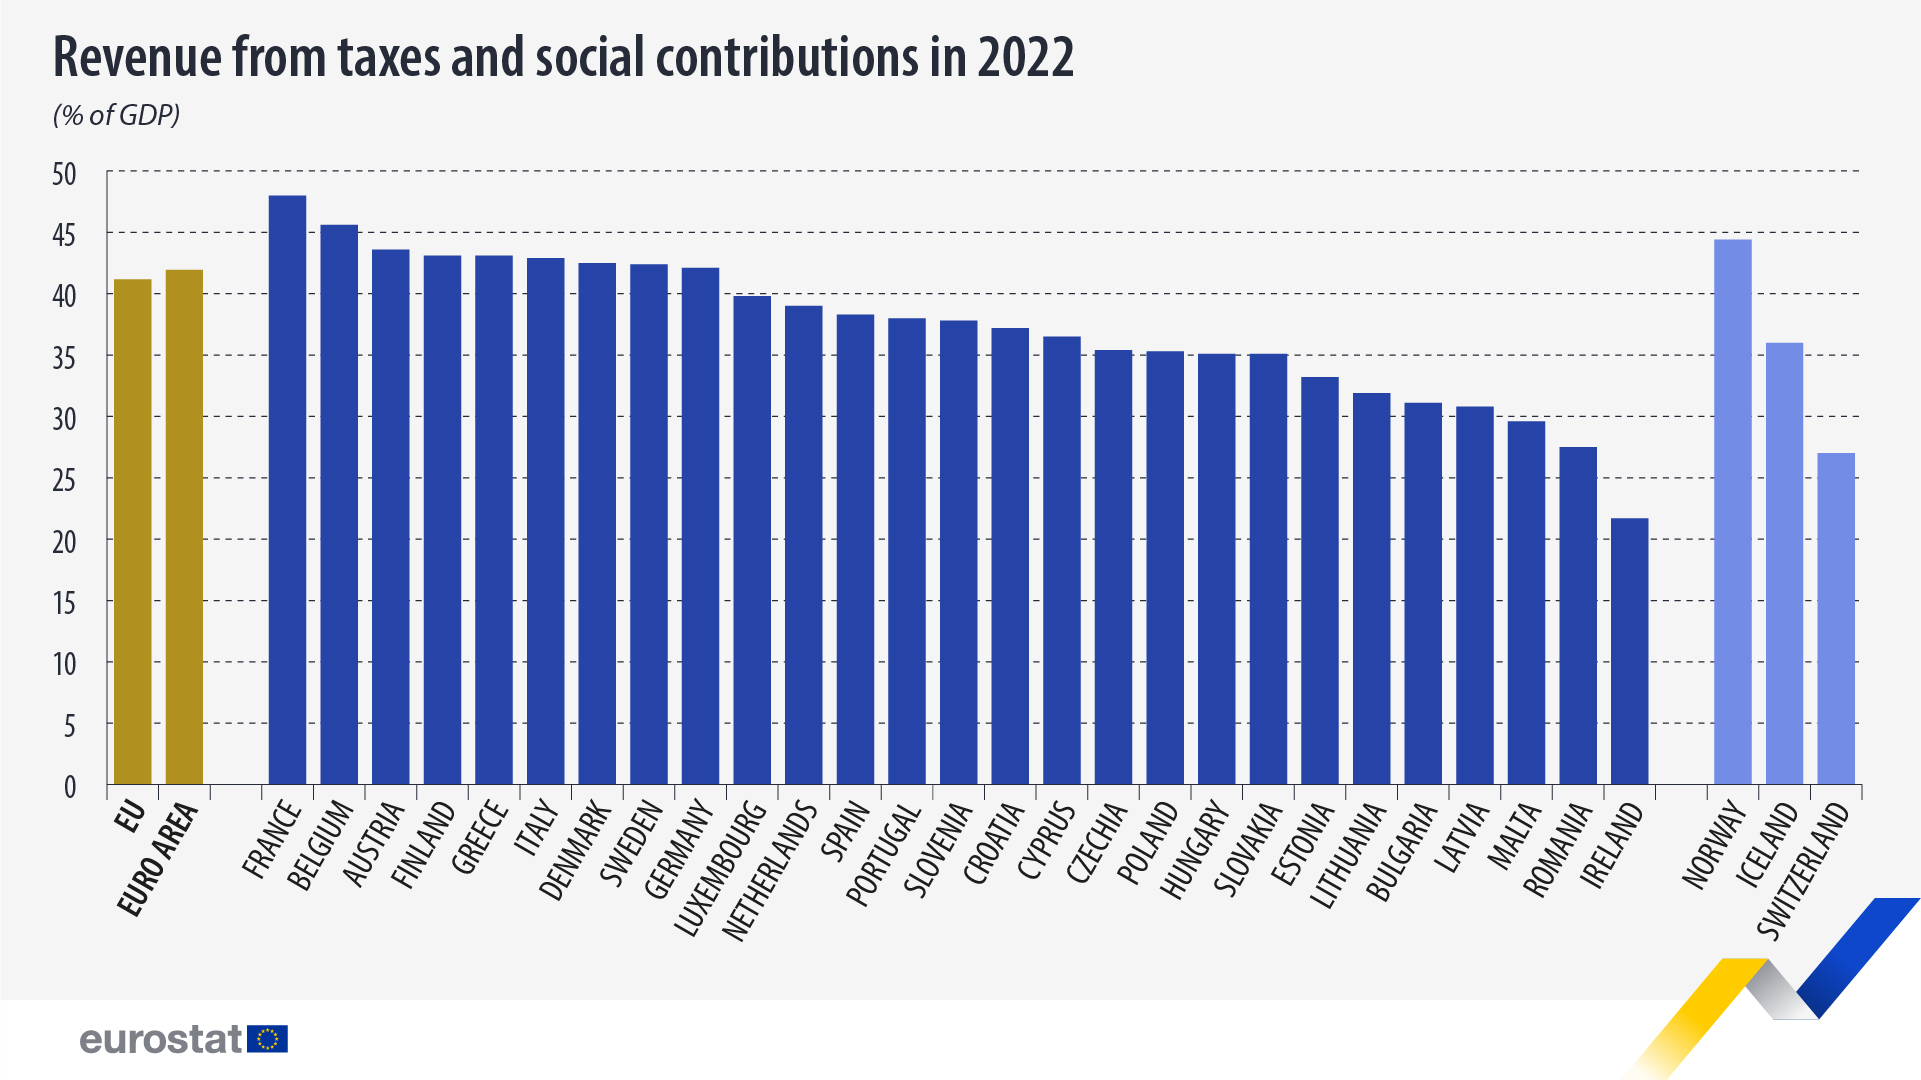
The tax-to-GDP ratio varied significantly between EU countries in 2022, with the highest shares of taxes and social contributions as a percentage of GDP being recorded in France (48.0%), Belgium (45.6%) and Austria (43.6%).
At the opposite end of the scale, Ireland (21.7%), Romania (27.5%) and Malta (29.6%) registered the lowest ratios.
Largest increase of tax-to-GDP ratio in Cyprus, largest decrease in Denmark
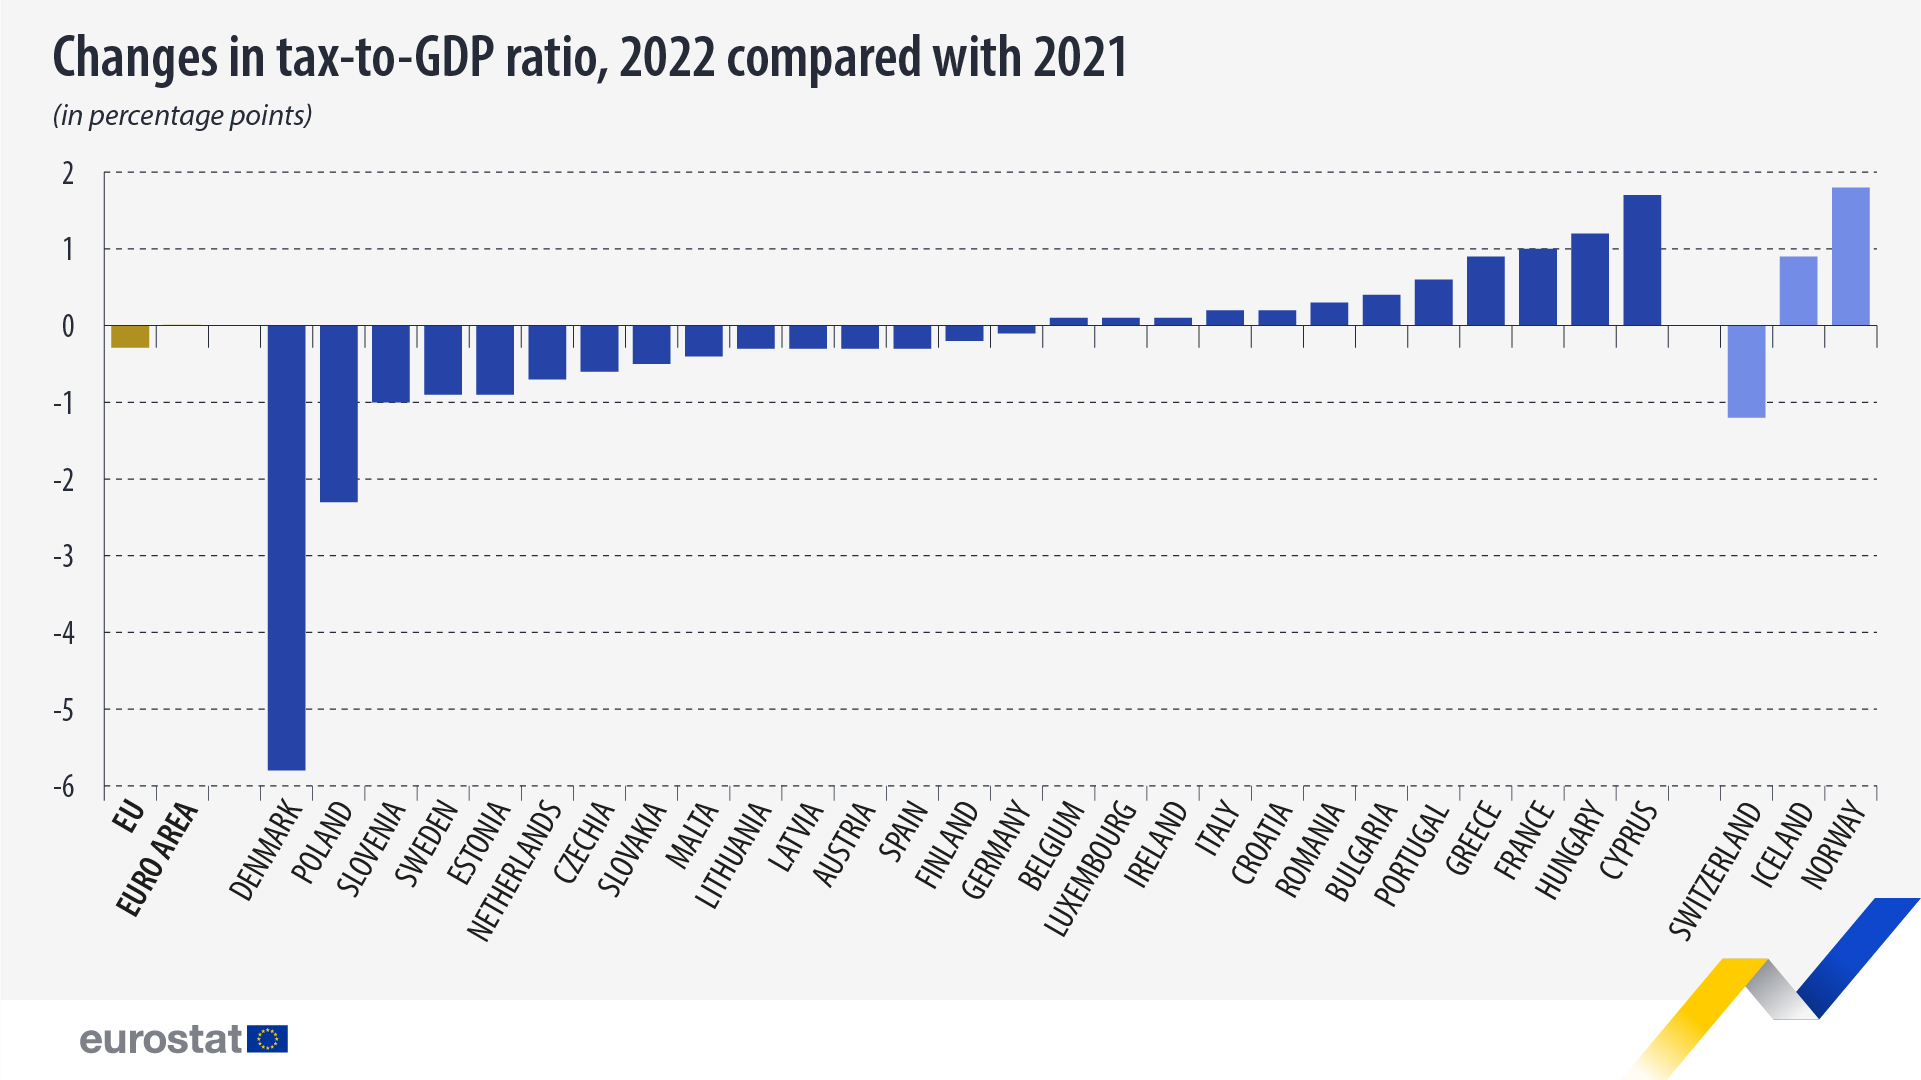
In 2022, compared with 2021, the tax-to-GDP ratio increased in twelve EU countries, with the largest increases being observed in Cyprus (from 34.8% in 2021 to 36.5% in 2022) and Hungary (33.9% in 2021 and 35.1% in 2022).
In contrast, decreases were recorded in fifteen EU countries, notably in Denmark (from 48.3% in 2021 to 42.5% in 2022) and Poland (from 37.6% to 35.3%).
Source: Eurostat
Legal Notice: The information in this article is intended for information purposes only. It is not intended for professional information purposes specific to a person or an institution. Every institution has different requirements because of its own circumstances even though they bear a resemblance to each other. Consequently, it is your interest to consult on an expert before taking a decision based on information stated in this article and putting into practice. Neither Karen Audit nor related person or institutions are not responsible for any damages or losses that might occur in consequence of the use of the information in this article by private or formal, real or legal person and institutions.


