February 13, 2023
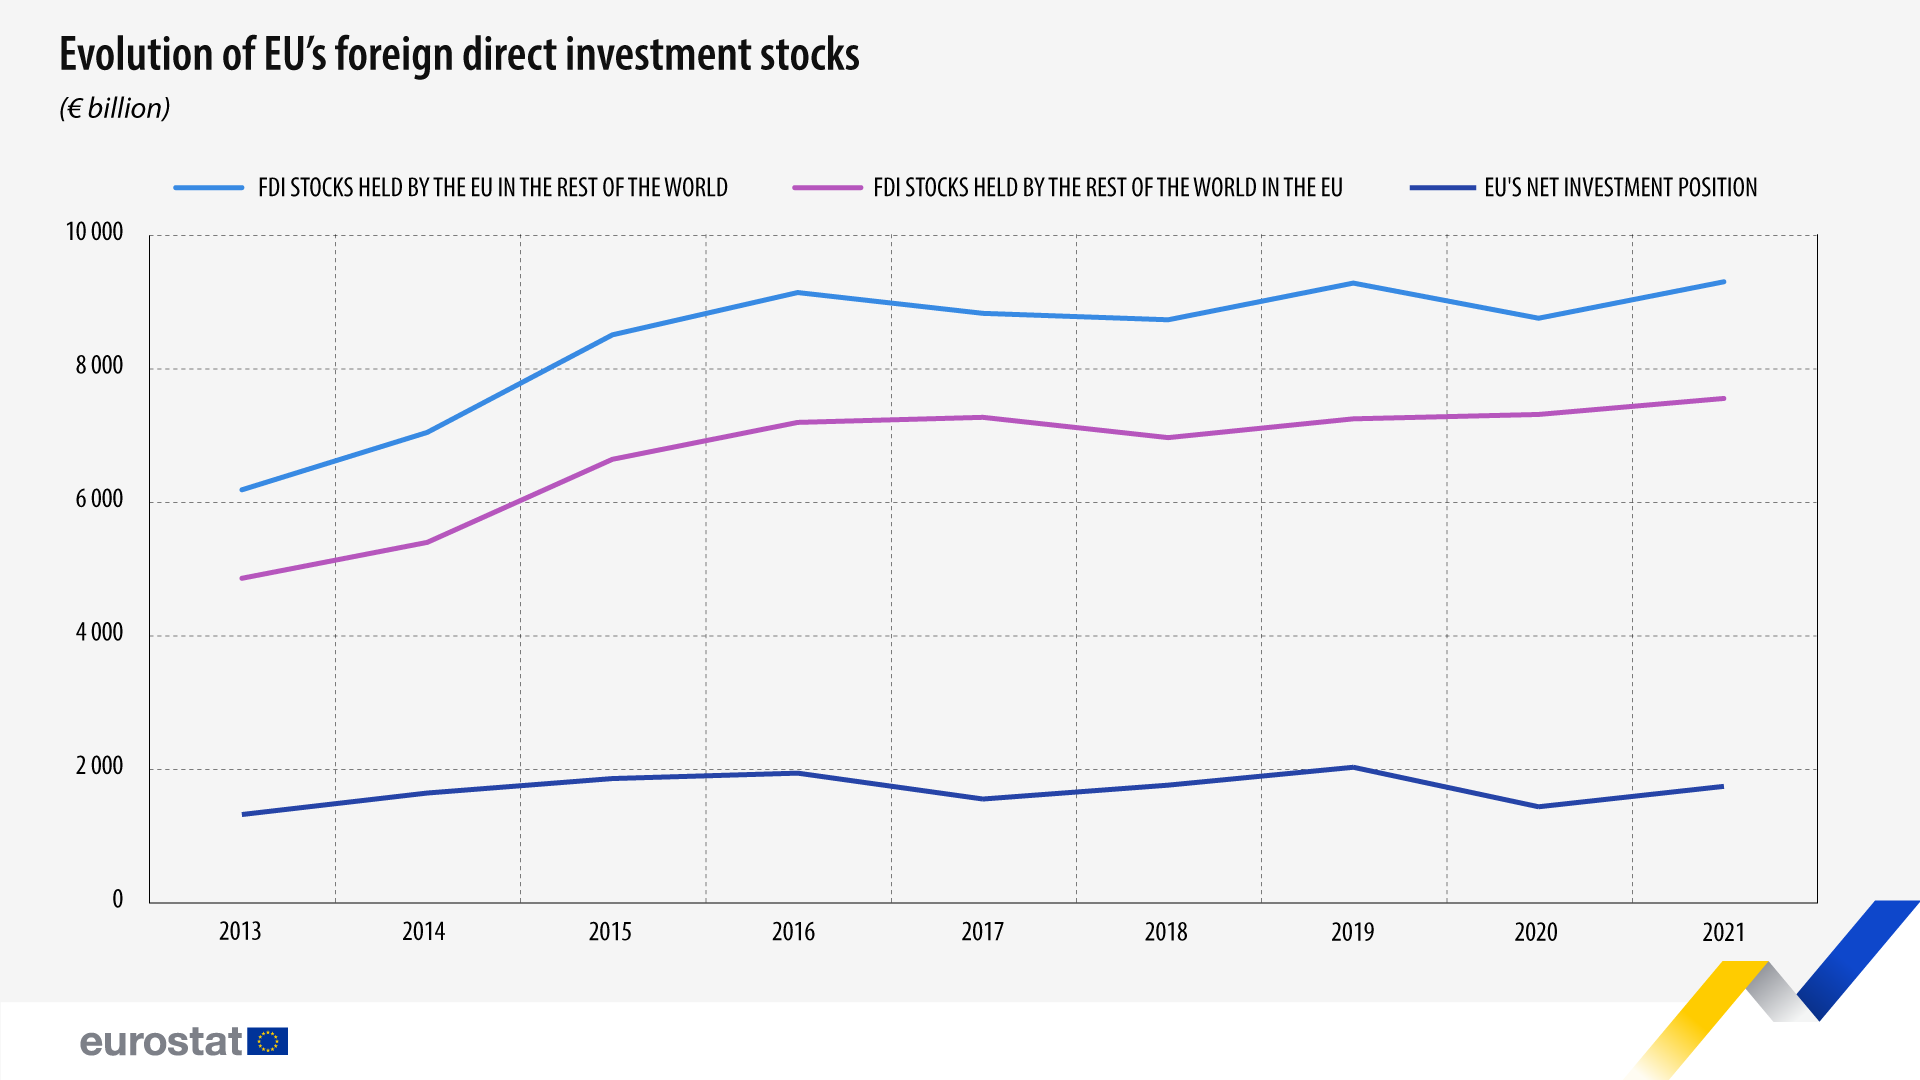
Net foreign direct investment (FDI) stocks held in the rest of the world by investors resident in the EU amounted to €9 306 billion (bn) in 2021, up 6% compared with 2020, after the sudden decrease in 2020 due to the impact of COVID-19. The total value reached in 2021 surpassed pre-pandemic values (€9 286 bn) by almost €20 bn.
The same tendency was seen in investment stocks held by the rest of the world in the EU, which increased to €7 558 bn in 2021, up 3% compared with 2020 and 4% (+€305 bn) compared with 2019.
In 2021, the EUˈs net investment position vis-à-vis the rest of the world increased by 21% to €1 747 bn (+€305 bn), compared with 2020.
Special Purpose Entities (SPEs) resident in the EU continued to play a significant role in FDI, albeit a less prominent one than a year earlier. At the end of 2021 they accounted for 33% of the total EU FDI stocks held abroad and for 38% of the FDI stocks held by the rest of the world in the EU, compared with 36% and 43% respectively in 2020.
USA and the UK: by far the main EU’s FDI partners
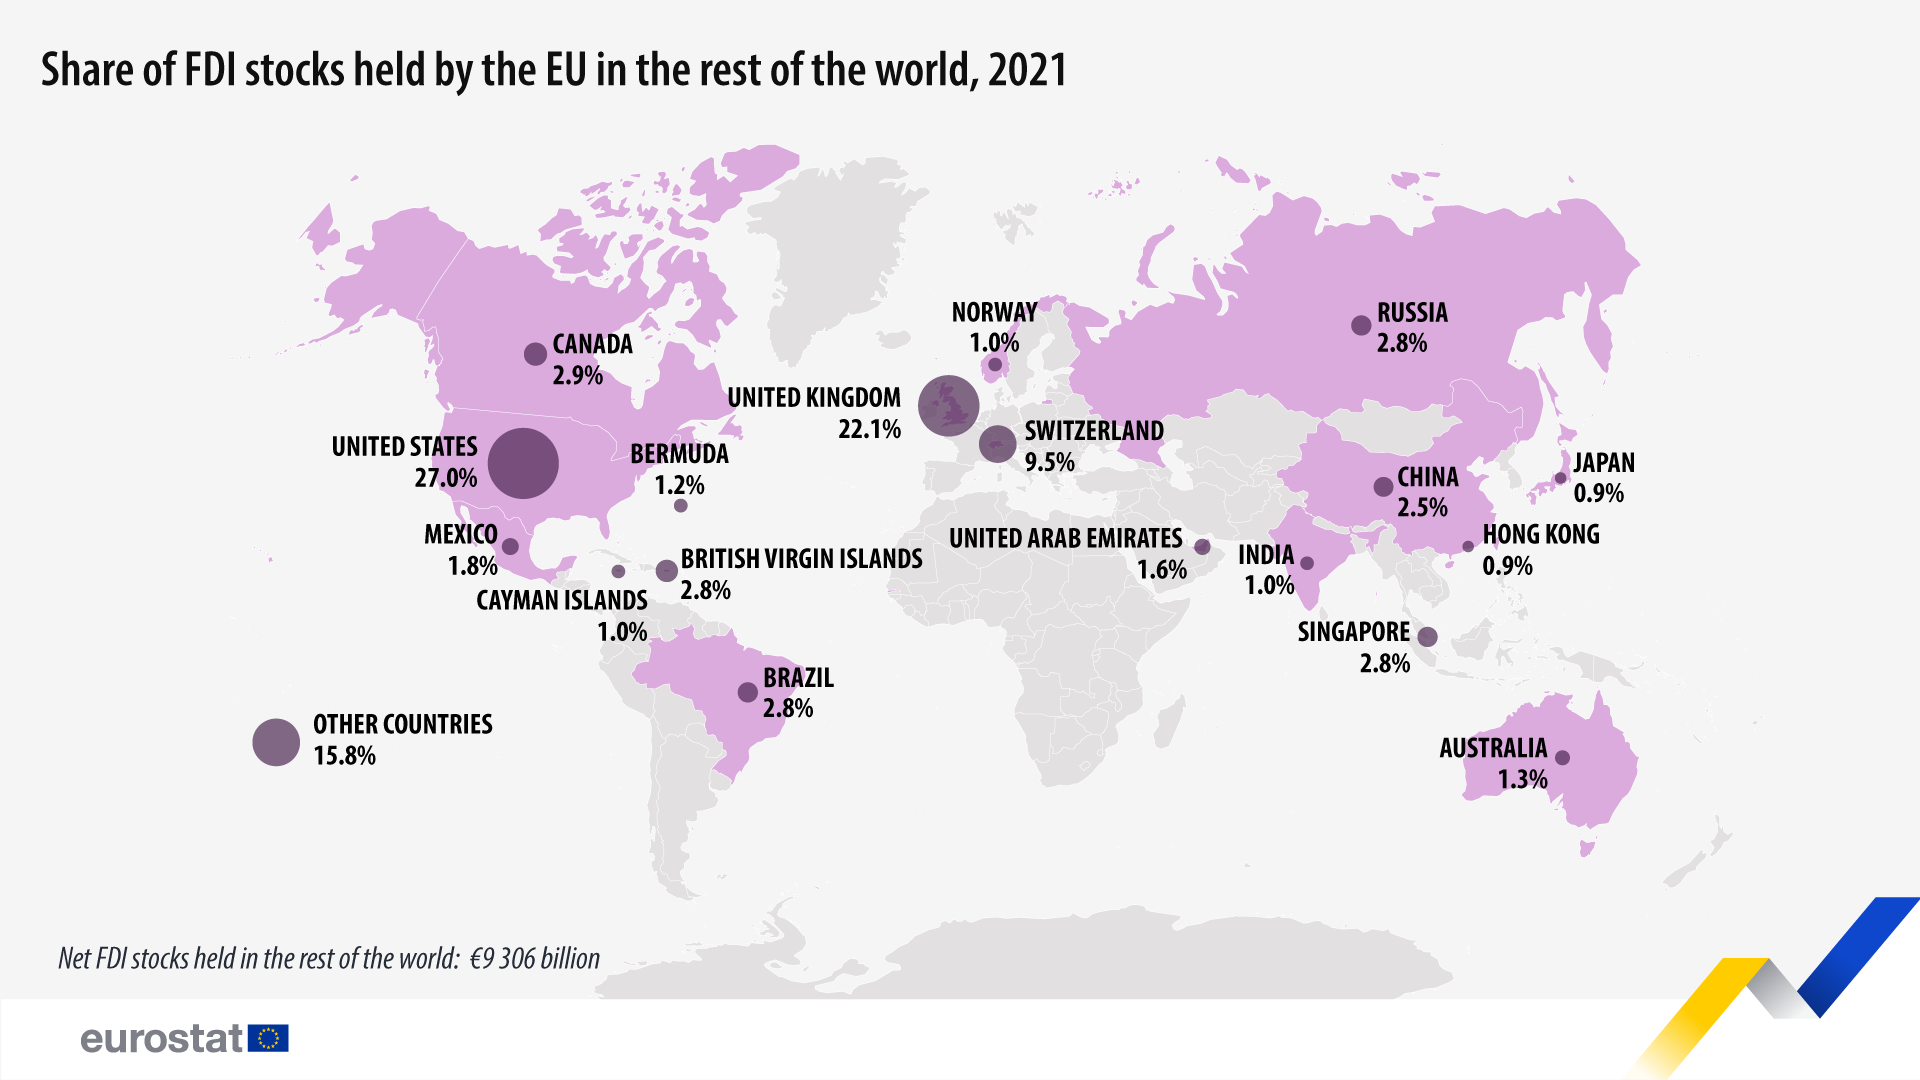
At the end of 2021, the United States absorbed 27% of the total FDI stocks held by the EU in the rest of the world (€2 512 bn), closely followed by the United Kingdom (€2 059 bn, 22%). They were far ahead of Switzerland (€885 bn, 10%), Canada (€270 bn), Singapore (€263 bn), Brazil (€262 bn), Russia (€255 bn) and China (€233 bn) all with a 3% share.
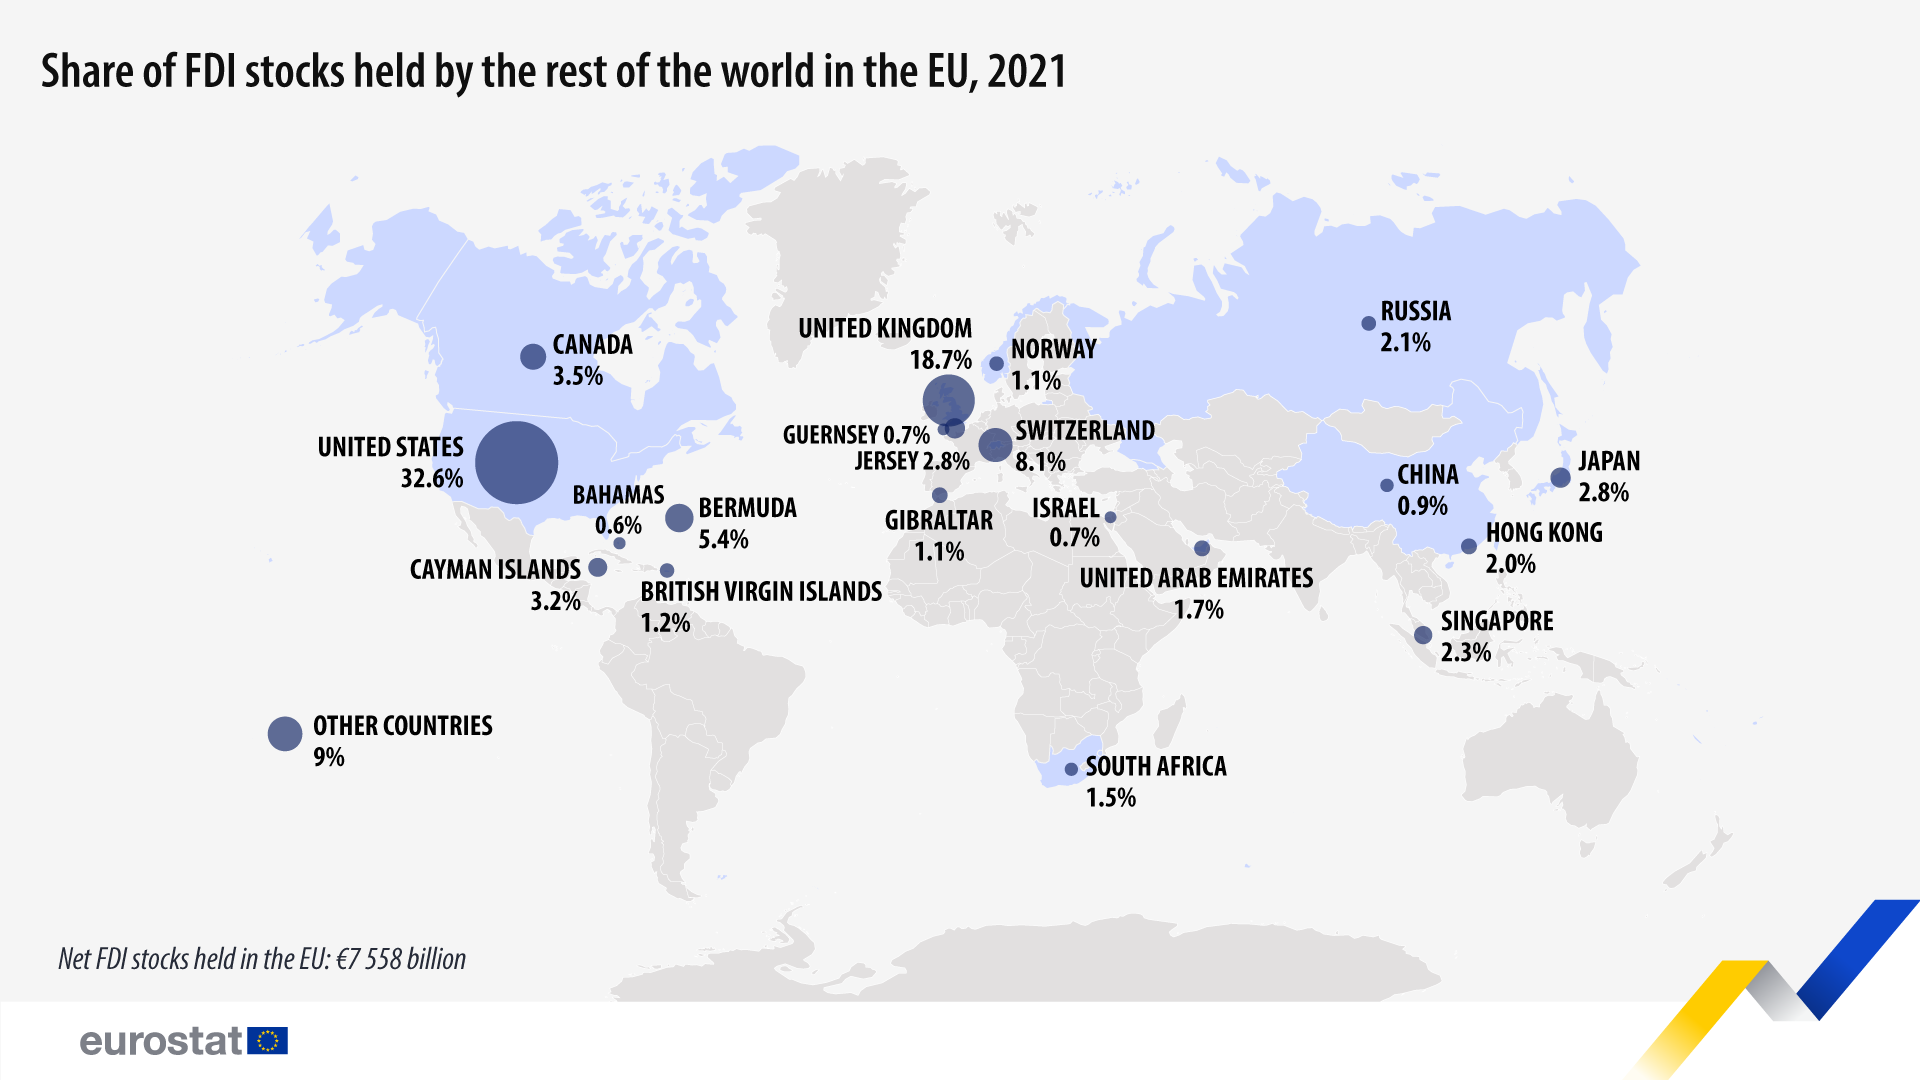
In the reverse direction, the United States’ direct investors accounted for almost a third (€2 465 bn, 33%) of the total FDI stocks held by the rest of the world in the EU at the end of 2021, followed by the United Kingdom (€1 414 bn, 19%). They were followed by those from Switzerland (€613 bn, 8%), Bermuda (€405 bn, 5%), Canada (€267 bn, 4%), Cayman Islands (€239 bn, 3%), Jersey (€212 bn, 3%) and Japan (€211 bn, 3%).
Source: Eurostat
Legal Notice: The information in this article is intended for information purposes only. It is not intended for professional information purposes specific to a person or an institution. Every institution has different requirements because of its own circumstances even though they bear a resemblance to each other. Consequently, it is your interest to consult on an expert before taking a decision based on information stated in this article and putting into practice. Neither Karen Audit nor related person or institutions are not responsible for any damages or losses that might occur in consequence of the use of the information in this article by private or formal, real or legal person and institutions.


